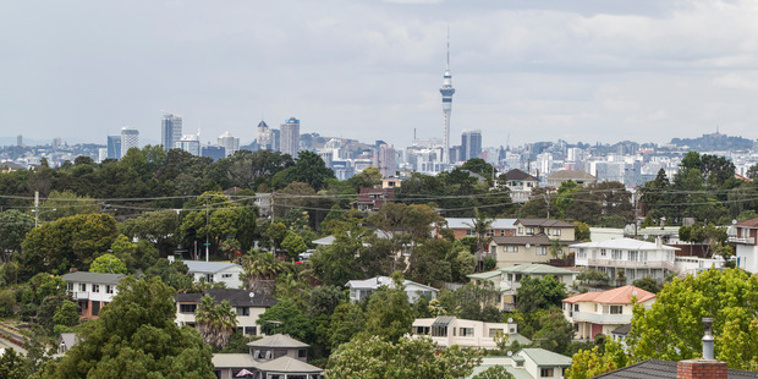
Auckland's average home value has jumped $338,000 or 32 per cent in four years according to new council valuations out today.
But while property owners might be happy at rising house values, they'll now also be paying an estimated average 6 per cent more to Auckland Council in annual rates bills after charges went up across most of the city.
The full details can be seen below in exclusive NZ Herald-Valocity interactive graphs and maps showing exactly where house prices have risen the most and which homeowners now face the biggest rates bills.
These show Omaha owners enjoyed the biggest percentage house value rises.
A typical home in the northern beach suburb now has a $2.64 million CV - up 58 per cent or $969,714 in the four years between the calculation of new CVs as at June last year and previous CVs in July 2017.
In terms of rates bills, owners in Aotea-Great Barrier Island and West Auckland's Henderson-Massey face the biggest jumps.
Aotea homeowners will now pay 18 per cent - or $232 - more in annual rates, while Henderson-Massey local area board owners will pay 13 per cent - or $321 - more.
James Wilson, from property valuers Valocity, said suburbs with the biggest house price jumps are typically holiday locations, like Omaha or Aotea, or areas with new housing springing up, like Otara, Point England and Manurewa.
Those with the smallest jumps include inner-city areas with lots of apartments, such as the CBD, Newmarket and Grafton, he said.
CVs are a major source of fascination for property mad Aucklanders and involve Auckland Council estimating the value of every residential and commercial property in the region.
They are typically released every three years, however, the latest Auckland Council CVs were delayed by close to 18 months due to uncertainty caused by the Covid pandemic and issues calculating property data.
CVs can influence the price a home sells for, or the size of loan that banks lend to a prospective home buyer or renovator.
They also play a part in determining how much each homeowner must pay in council rates.
Where home values have risen most by percentage
While Omaha had the biggest house value jumps percentage wise, Red Hill in Auckland's far south wasn't far behind.
House prices in the suburb where many new homes are being built jumped 57 per cent to hit an average CV of $950,997.
Aotea-Great Barrier Island came next with a 56 per cent jump to $799,143, while Otara jumped 55 per cent to $896, 513.
Other suburbs with big price jumps included Mangere East, Tawharanui Peninsula, Mangere, Point England, Rosehill and Manurewa East.
Wilson said homes had typically risen in holiday locations because during the Covid pandemic demand had risen among buyers, yet there remained a shortage of houses for sale in those areas.
Where home values have risen most by dollar value
While Omaha rose the most percentage wise, Herne Bay homes rose the most by dollar value.
Herne Bay homes now have an average CV of $3.8m - a $1m jump compared to the average 2017 CV in the suburb.
Waiheke Island prices also soared, jumping by $894,582 to an average $3.4m CV, while St Marys Bay homes jumped $865,578 to a new average $3.1m.
Other big jumpers included Westmere and Ponsonby, jumping $850,000 and $844,000 respectively.
Auckland's most expensive suburb
Herne Bay might be the suburb with the highest average CV at $3.8m, but Remuera showed it is still home to the most multi-millionaires.
The latest valuations show Remuera has 11 homes valued between $20m and $50m compared to Herne Bay's 10.
However, when it comes to homes valued between $10m and $20m, Remuera has a whopping 111 houses, compared with just 32 in Herne Bay.
Where prices rose the slowest
"The suburbs with the least growth were concentrated in Auckland Central and surrounding suburbs, where apartments are the dominant property type," Valocity's Wilson said.
Demand for inner city apartments fell off when international borders were closed to students, he said.
That led property to rise just $14,000 or 2.5 per cent to a new average $615,597 CV in Auckland Central.
Taken over four years that's a price rise of just over $3000 a year.
Grafton and Newmarket rose by 11 per cent each to hit new average CVs of $665,397 and $983,586, respectively.
Overall, apartments CV across the city rose 8 per cent, while flats rose 27 per cent and stand-alone homes and townhouses rose 34 per cent, Auckland Council said.
Auckland Capital Valuations 2021
This map shows the median 2021 capital valuation for residential and lifestyle properties in Auckland suburbs. Use the search box to find for your address. Click the button at the base of the map to see how much the median value has increased since 2017.
Business CVs
Overall, Auckland's more than $590,000 residential and commercial properties rose by 34 per cent in value according to the latest CVs.
Among business properties, industrial buildings rose the most in value with average CV values now 53 per cent higher than four years ago.
Commercial values jumped 29 per cent, lifestyle blocks jumped 29 per cent and rural properties 24 per cent.
Who will be paying the most in rates bills
Auckland Council estimates 373,555 property owners will now face higher rates bills, while 138,275 will see their bills go down.
Out of those, 139,359 are estimated to have their bills rise by more than 10 per cent, council said.
While Aotea-Great Barrier Island and Henderson-Massey local board area owners face the stiffest rise in rates bills by percentage, owners in the Maungakiekie-Tamaki local board face the biggest dollar value rise in rates.
The local board area includes suburbs, Onehunga, One Tree Hill, Penrose, Southdown, Mt Wellington, Panmure, Tamaki and Glen Innes, with owners there now paying $352 more per year in rates as their yearly bill rises to $3,276.
Owners in Orakei will pay the largest rates bills overall as they face a 4.8 per cent increase to an annual bill of $5,169.
According to Auckland Council, Waiheke Island residents pay the highest local government charges as a percentage of household income, with rates and water bills adding up to 4.77 per cent of the island's typical $81,744 income.
Howick residents face the next highest bills with rates and water adding up to 3.83 per cent of the area's typical $112,528 income.
Home owners will have to pay the new rates charges in the 2022/2023 rating year beginning from July 1.
CVs are used as a measure to set rates, but they do not change the total dollar amount the council collects from rates.
Instead, the council decides how much money it wants each year, and then uses CVs to help work out the share each home and commercial property owner pays.
Property owners will receive valuation notices in the mail, including information on how to object to their CV valuations, from next week.
Are the valuations already out of date?
Auckland Council estimated the values of every property in the region as at June 2021.
Yet the Auckland property market enjoyed another six months of rising house prices after that.
As an example, Omaha's new average CV value calculated at June last year is $2.64m.
However, Valocity's index value for the suburb puts the average home price at $2.78m - already $140,000 higher.
When it comes to Herne Bay, the new typical CV is $3.8m, but Valocity estimates the current value to be almost $400,000 higher at $4.2m.
Take your Radio, Podcasts and Music with you


