There are 5535 new community cases of Covid-19 in New Zealand today - and a further 14 Covid-related deaths.
The Ministry of Health reported 720 people in hospital with the virus, including 21 in intensive care.
Of the 720 people in hospital with the virus, 18 are in Northland, 96 are in Waitematā; 63 are in Counties Manukau; 82 are in Auckland; 60 are in Waikato; 40 are in Bay of Plenty; 11 are in Lakes; 32 are in Hawke's Bay; 40 are in MidCentral; 13 are in Whanganui; 16 are in Taranaki; two are in Tairawhiti; six are in Wairarapa; 61 are in Capital & Coast/Hutt; 11 are in Nelson Marlborough; 132 are in Canterbury/West Coast; 13 are in South Canterbury and 24 are in Southern.
The average age of those with Covid in hospital is 66.
The seven day rolling average of hospitalisations of people with Covid is now at 762 - up from 737 a week earlier.
Of the 14 people who died with the virus, three were from Auckland region, three were from Waikato, four were from Hawke's Bay, one was from Taranaki, one was from MidCentral, one was from Wellington region, one was from Southern.
Six were in their 80s and eight were aged over 90. Of these people, 11 were women and three were men.
"This is a very sad time for whānau and friends and our thoughts and condolences are with them," the Ministry of Health said. "Out of respect, we will be making no further comment on these."
How much Covid is in your region's wastewater?
The ministry's figures come as just-released wastewater data has added a fresh perspective to our Omicron wave, showing that what scientists have learned from sewage sampling has generally matched up with daily case numbers.
ESR's online Covid-19 wastewater dashboard, which went live last week, enables Kiwis to check what quantity of SARS-CoV-2 that scientists are finding in their region – and then compare that to case numbers reported each day.
Because traces of the virus or its RNA can be detected from what we flush down the toilet, wastewater-based epidemiology has played an increasingly large role in our pandemic toolbox.
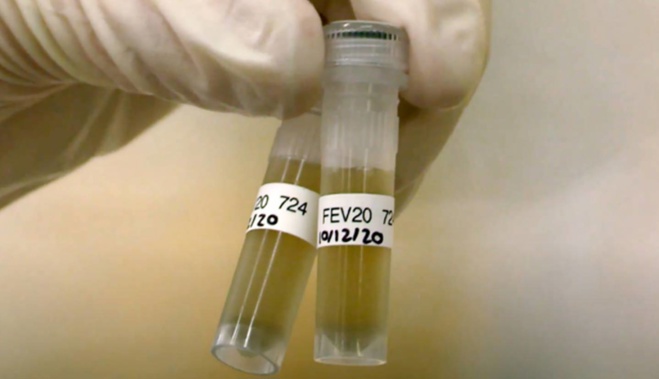
As part of the surveillance, samples are sent from each plant to ESR, where scientists concentrate viruses, and extract the viral RNA from it.
When there's enough of the virus in the sample to quantitate, scientists are able to convert that to a viral load of genome copies per day, per person – helping build a picture of infection prevalence in given catchment populations.
National data from this surveillance showed how quantifiable amounts of virus were only being picked up about 10 per cent of sites in the opening weeks of the year.
By mid-February, quantifiable levels were detected at more than a quarter of them.
A week later, that proportion had shot up to around two thirds – and now the virus was being detected, often in high levels, across all sites monitored nationwide.
"Before February, we were only seeing Covid-19 in a few catchments – mainly in Auckland – but then it really took off," ESR senior scientist Dr Joanne Hewitt said.
"As Omicron spread across the country, we saw levels go up not just 10 times, but 1000 times, compared with background levels."
/cloudfront-ap-southeast-2.images.arcpublishing.com/nzme/62JAVB7XDCPXQHB32TAOTH7LB4.jpg)
Screening for the Sars-CoV-2 virus has been carried out in New Zealand wastewater plants since 2020. Photo / Supplied
In Auckland, on February 13, there were still just 220 community cases and nearly 387,000 average genomes copies of the virus per person.
But by March 6, at the height of the first wave, those rates had jumped to 10,779 cases and more than 14.2 million genome copies per person per day.
/cloudfront-ap-southeast-2.images.arcpublishing.com/nzme/A6LWR7ZCUWQ6E4HRDSEDE6ZHLU.jpg)
This graph shows wastewater and case number trends in the Auckland region. Image / ESR
While those genome copies fell back to about 5.2 million genome copies in mid-April, they'd risen again to 12.3 million copies by mid-July, amid a current wave fuelled by the BA.5 Omicron subvariant.
The data showed similar – but slightly different – pictures in other regions.
In Canterbury, where little trace of the virus was being found in wastewater in mid-summer, volumes peaked weeks after Auckland, reaching more than 12.2 million genome copies per person per day on March 20.
As at July 10, that quantity had risen to 28.7 million genome copies per person per day, but then dropped back.
/cloudfront-ap-southeast-2.images.arcpublishing.com/nzme/2V4NS36JER7MZRMV3B52766LWY.jpg)
This graph shows case number and wastewater trends in Canterbury. Image / ESR
In Wellington, observed quantities stood at 39.7 million genome copies per person per day on July 10 – nearly climbing to the 45.8 million genome copies detected in the region at the peak of the first wave, on March 13.
Nationally, volumes fell slightly from 15.9 genome copies per person per day on March 6, to 5.6 million in mid-June – before climbing again to 13.3 million as at last weekend.
/cloudfront-ap-southeast-2.images.arcpublishing.com/nzme/3F3WCLDZAY4F45WQNYXBWVAEIE.jpg)
This graph shows how the national quantity of virus in our wastewater (green line) has risen in step with Covid-19 case numbers (blue). Image / ESR
While some experts have speculated this wave may have already peaked, Hewitt said last week's wastewater results would be informative.
She said there was much more she and colleagues wanted to do with the programme – namely bringing a tighter focus on what sub-variants were circulating.
At the moment, variant analysis was being carried out for only 21 sentinel sites.
Over just the past six weeks, ESR has seen the proportion of BA.4/5 across the 21 sites balloon from less than 3 per cent to 73 per cent.
"We're looking at lots of different ways to get better information on the variants that we now have – but also to detect variants that we might not have known were here yet," Hewitt said.
"In addition to sequencing, we've started to use digital PCR to detect specific mutations – which quickly indicates the proportion of variants in the wastewater over time. This method will allow us to scan more samples than the current 21 sites."
There was also potential to use wastewater surveillance for probabilistic modelling – complementing what trends officials were able to draw from reported community cases and genome sequencing.
What wastewater surveillance couldn't do, however, was reveal precisely how many cases were present in a region at a certain time.
"Although we know that levels of the virus in wastewater go up as cases go up, in a given catchment of 1000 people, you can have one person shedding as much virus as 10 people somewhere else," she said.
"So, it's tricky to translate to precise case numbers, but this is something that scientists are looking at globally."
Beyond Covid-19, Hewitt said there were plans to expand wastewater surveillance to other viruses, such as influenza and respiratory syncytial virus (RSV).
Take your Radio, Podcasts and Music with you


